
An Illustrated Guide to the Biggest Dragons in Fantasy by The Daily Dot
Infographics are visual representations of information. Colorful and pictorial, they tell stories in a compact snapshot, conveying information clearly and quickly. We consume infographics daily. Is there a better way to bring home the importance of infographics than with an awesome, interactive informational graphic? I don’t think so. NeoMam Studios created just that with Thirteen Reasons Why Your Brain Craves Infographics. Please check it out. It serves as a testimonial and example of how powerful infographics can be.
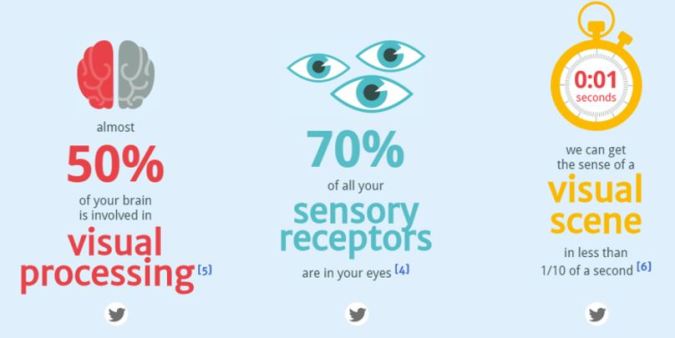
Thirteen Reasons Why Your Brain Craves Infographics By NeoMam Studios
Of course, teachers can use infographics to convey information to students, but students can also use the process of creating infographics as an exercise in active knowledge making and really impress their instructors. Before the visual elements come together, students must research and gather the content for their infographics. The process of creating an infographic also demonstrates other active knowledge making concepts such as creativity, inquiry learning and participatory learning.
There are several ways to create infographics. When I design a new infographic, I use Adobe Illustrator, because I am a graphic designer. But, Adobe software is expensive, and Illustrator can be a challenging program for those not formally trained. Microsoft PowerPoint can also be used to create charts, graphs and some pretty nifty infographics. Again, not everybody has Microsoft Office, and some people do not like using PowerPoint.
The best options are online learning spaces, like Infogr.am and Picktochart, which make creating and sharing infographics easy and free.

This Infogr.am interactive infographic displays additional information when you hoover over the pie chart.
Infogr.am
Infogr.am is an easy app for creating infographics on the web. You can build real-time, interactive, visually complex, shareable, embeddable and downloadable infographics using more than 30 chart types, text objects, videos, images and maps.

Infogr.am Pros and Cons by Me
Infographics are automatically saved to your library and all your changes are saved as they happen. There are multiple options for sharing an infographic. Sharing options are characterized by its goal – public sharing for a wider audience or private sharing to restricted recipients.
If you want to save infographic as a printable image, you have to download it. Downloading is a pro feature.
The public sharing, or free plan, allows you to:
- Share your infographic via your website or a blog post.
- View an infographic in your browser, copy the public link and mail it to somebody.

Piktochart is a good option for creating colorful infographics, like this example.
Piktochart
Piktochart is a web-based infographic software, which allows users without intensive experience as graphic designers to create professional-grade infographics, using templates.
You can save and download your infographics with a free account. With a pro account, you can access even more templates and graphics while also being able to download higher resolution versions of your infographic. Pro users also have privacy settings: you can choose to share your infographic with friends or set it to private for your eyes only. Your infographic will contain an Piktochart watermark unless you purchase a pro account.
Publishing & Sharing via Piktochart
- Publish your infographic and access the html code to embed in your website or blog
- Generate a URL for you to share via email or instant messaging
- Some publishing options are only available with a pro account
- Download an infographic for the web or print as a jpeg or png
- Download your infographic as a pdf with a pro account
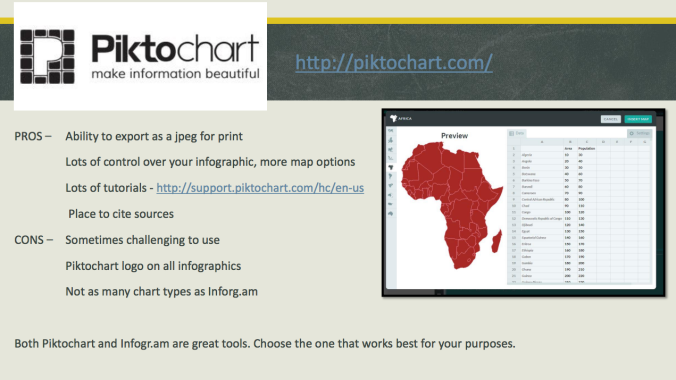
Piktochart Pros and Cons by Me
Students can use Infogr.am and Piktochart infographics to suppliment discussion board and research assignments, presentations and more. They can also embed them in blog posts or PowerPoint presentations. Existing infographics can be searched from either site to inspire and inform students and educators alike.
4 Tips for Creating Effective Infographics
The educator and graphic designer in me would like to briefly discuss the basic principles of creating an effective infographic, which should be shared with you before I set you free to explore and create your own visual materials. Here are four really good tips for creating effective infographics:
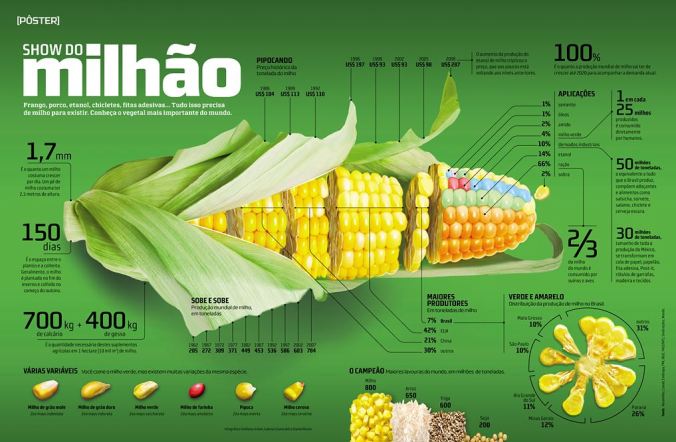
This infographic by Gabriel Gianordoli serves as a great example of using a strong focal point to help organize information.
- Create One Strong Focal Point – Infographics too often turn into a complicated mess of graphics and text. As a designer, it’s very easy to get carried away and ultimately come away with something that’s more overwhelming than helpful. One way to reign this tendency is to rely heavily on one central graphic that strongly communicates your overall theme or message.

This infographic by Grant Thornton uses the metaphor of racing to illustrate the global race to economic growth.
- Use Applicable Metaphors – Some of the most engaging infographics take boring, complex information and apply a graphical metaphor that’s so perfect even laymen can almost instantly understand what is being stated.

BP took a sliced up the ocean floor to explain the inner workings of an 8,000-foot relief well with this infographic.
- Take a Slice – Sometimes infographics aren’t merely used to jazz up raw data points but to communicate a real world situation. Under these circumstances, one popular go-to strategy is to illustrate a scene using three dimensional graphics that almost look like a scientific sample has been taken from the world similar to how a scientist would sample a tree.

Section Design let the visuals do the heavy lifting of explaining the evolution of the mobile phone in this infographic.
- Tell a Visual Story – Since the goal of an infographic is to make for a quick read, your design should tell a story in an instant. Infographics should be very visual experiences that don’t necessarily rely too heavily on the text. It should be there for those that want to take the time to read it, but your pictures should carry the burden of communication fairly well on their own.
It is easy to see how infographics can be utilized by both teachers, students and those like me, who are both.
Students: Have you ever created an infographic as an assignment requirement? If so, what were the details of the assignment? What software did you use? And, how did you share your infographic with your peers?
Teachers: Have you ever encouraged students to create infographics as an assignment requirement? If so, what were the details of the assignment? What software did students use? And, how did students share their infographics with their peers?
Sources
- http://neomam.com
- https://infogr.am
- http://piktochart.com
- http://designshack.net
- http://www.hubspot.com
- Louise Jett
Blogger’s Note: This post will actually serve as an example for my current social media marketing students, who will soon be re-purposing a former assignment into a blog post. I actually created this post from one of my study guides, with which the students are already familiar. I love thinking of new ways to share knowledge! 🙂
